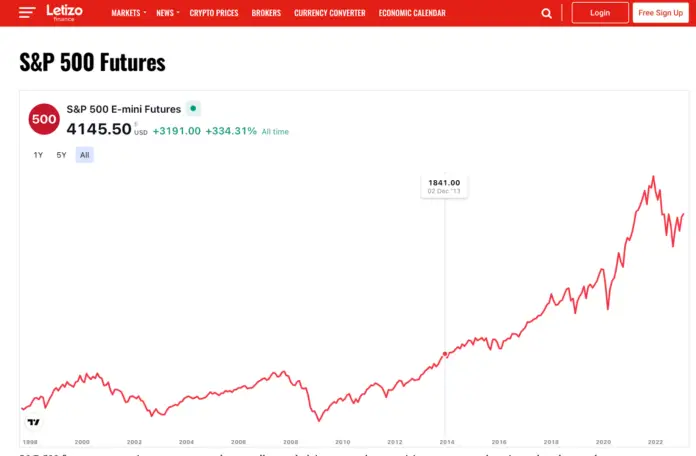
A “golden cross” is a situation on a chart where the short-term and long-term moving averages intersect from bottom to top. This situation is usually considered a signal for further market growth. Roughly speaking, “it is possible to take”. The rally in the stock market led to the emergence of a rare figure of technical analysis called the “golden cross”.
The SP 500 stock price chart is an important indicator of the economic situation. All top brokers offer this index for trading. “Golden cross” is a special type of “bullish” signal, you can say something magical and legendary, which technical analysts see as an indicator of a possible big rally. This figure usually appears at the late stage of a recession or during the signs of economic recovery, the experts at Bank of America noticed. The current “golden cross” is the 49th since 1928.
Impact on s&p 500 stock price chart
According to analysts at Bank of America, the index’s return after the “golden cross” reaches its peak 30, 65, and 195 days after the appearance of the signal. In 75% of cases, the growth of the S&P 500 stock price chart turns out to be higher than average.
Ryan Detrick, a chief market strategist at Carson Group consulting firm, pointed out that the current sp500 price rose 15 out of 16 times over the next 12 months when the indicator charted a “golden cross. The average annual return on that rise was 15.7%; the average six-month return was 9.8%, the average three-month return was 6.7%, and the average one-month return was 1.9%. Stay tuned to letizo.com for the latest news on the index.
The Golden Cross runs counter to experts’ expectations
However, the Golden Cross runs counter to experts’ expectations. At the same time, the signal runs counter to the expectations of many analysts based on the current situation in the global economy.
Thus, some analysts are of the opinion that as long as the economy withstands a rise in interest rates, the U.S. regulator will raise it in order to reduce inflation and inflation expectations as soon as possible. That’s why if the regulator continues to persistently tighten the monetary policy, the sentiment in the market “may change very quickly and a new wave of decline will begin.
Thus, in a press release after the last meeting the regulator said that although inflation has weakened, it remains at elevated levels, and added that it believes further rate hikes are appropriate.
For information, there is also the “Death Cross,” which is the exact opposite of the Golden Cross. The intersection of the short-term and long-term moving averages also determines this technical analysis pattern. However, in the case of the Death Cross, the MA 50 crosses the MA 200 downwards.
3 reasons the daily price chart might have a sad fate this year
Some Wall Street experts are worried about possible dismal results for the S&P 500 in 2023 after the index suffered its biggest losses since 2008 last year amid rising inflation and strong Fed policies.
Here are the reasons the sp500 daily price chart could be negatively affected in 2023:
- Bank of America $BAC chief stock strategist Savita Subramanian, the S&P 500 index is crowded because too many investors have piled into the S&P 500, which will exacerbate any bouts of volatility as traders move to sell en masse when problems arise. She urged investors to get out of crowded areas of the market, such as technology, and bet on energy and small-cap stocks.
- Mike Wilson, a chief stock strategist at Morgan Stanley’s $MS, believes the decline in corporate earnings will bring a loss to the stock market. S&P 500 companies will report weak earnings this year as the market has not yet recovered from the effects of the Fed rate hike in 2022, and lower inflation could cut into earnings. Investors’ expectations for corporate earnings in 2023 were about 20 percent higher, meaning the market could be hit this year with the worst earnings recession since 2008. He predicted that the S&P 500 would fall 24% in the first half of the year.
- U.S. economist John Hussman, who announced the dot-com crash, believes stocks are still overvalued despite the sharp sell-off last year, so the index could show negative returns over the next decade. Hussman, who predicted the bursting of the dot-com bubble in 2000, noted that their favorite measure of S&P 500 valuation is at the same level as it was at the peak of the dot-com era.
The basic goal of “The Business Goals” is to help the entrepreneurs’ community in achieving their goals and business objectives by providing the authentic and latest entrepreneurial ideas.


